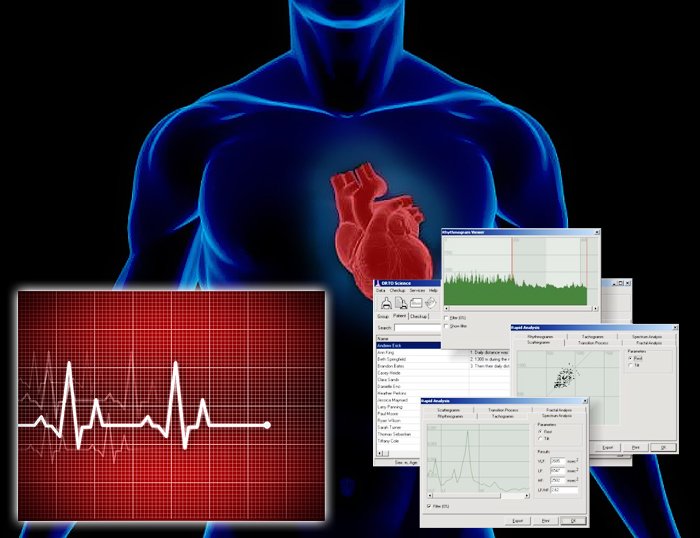
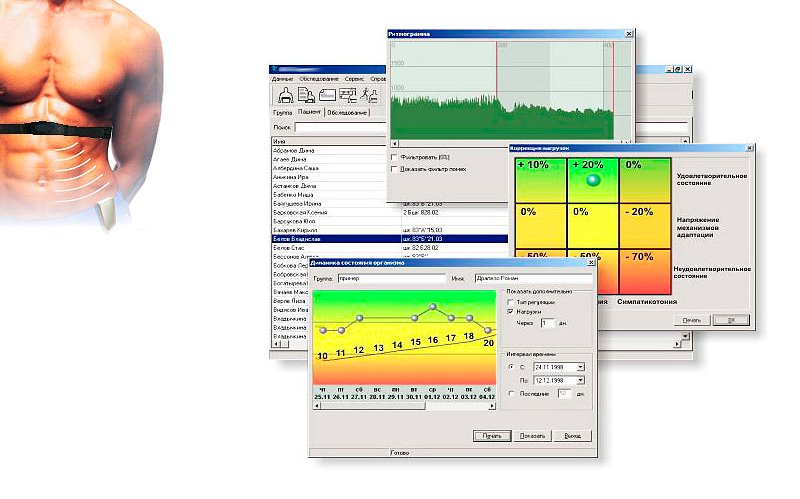
A technology of this kind was used in the training of astronauts. Heart rate monitoring remains one of the most important indicators in the fields of biology and medicine, with prognostic information about the functional state and adaptive capacity of the entire organism able to be obtained through just one reading. Heart rate variability is a measure of the variation in the beat-to-beat interval, also known as RR variability, where R is the peak of the graphical deflection caused by a heartbeat as displayed on an electrocardiogram. There are many applications of HRV data, with an enormous number of heart defects and emotional responses alike reflected in the variations of the beat-to-beat interval.
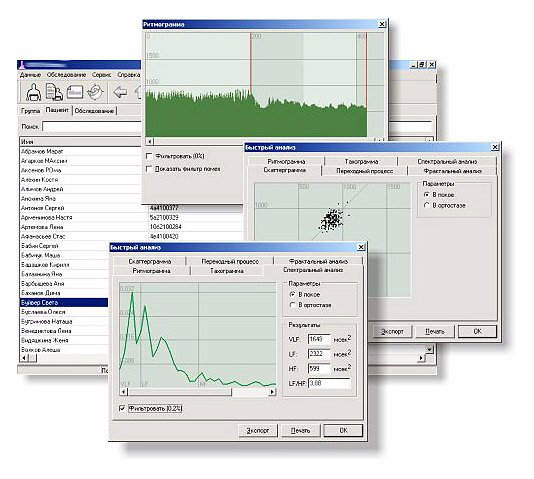
Measuring HRV is a non-invasive and relatively simple task once margins of error and other irregularities are accounted for, with electrocardiography, blood pressure and ballistocardiograms all used as measurement tools. Various time-, frequency- and geometric-based models have been developed in the field of HRV analysis. Temporal analysis is the simplest method, and can involve measuring the standard deviation of beat-to-beat intervals, usually over a five minute period but sometimes over 24 hours; the number of pairs of successive intervals which differ by more than a certain length of time, usually 20 ms or 50 ms, in a given period; or the range of beat length over a predetermined measurement period. HRV can also be assessed based on geometrical or graphical analysis of a data sample. Graphical analysis can provide an in-depth view of various aberrations in heart rates, such as excessively short or long intervals observed, asymmetrical heartbeats. Spectral methods of analysis can show frequency bands and calculate the number of heartbeats which fall within the specified bands, speeding up analysis. The Fourier transform provides analysis of waves of interval length. Long-term and even non-linear testing methods also exist.


 2002–2025